Interactions with the atmosphere

It is always really satisfying to be able to apply the knowledge learnt from education to real life. During reading week I captured the image above, it shows sunset and the various colours of the spectrum on the sky, why does this occur?  How come these are the colours? Are some of the questions that were answered in this week’s laboratory practical and subsequent readings.

There are interactions within the atmosphere that result in the different alterations of light and also on remote sensing systems, most notably absorption, refraction and scattering. Different wavelengths are absorbed as a result of the different gases that compose the atmosphere, these are varied across the energy emitted, causing ‘windows’ where radiation reaches the earth’s surface. Most remote sensing sensors operate by measuring the reflection of the radiation that is able to pass through the atmosphere and be reflected back, however some measure the absorption such as those from carbon dioxide (CO2) and other gases (NASA, 2017). Refraction occurs when radiation interacts between mediums of different densities, which can pose issues when trying to calculate the return of radiation (Aggarwal, 2004). Finally scattering, is the redirection of paricles within the atmosphere (Campbell, 2011).

There are 3 types of scattering, each related to different particle sizes, Rayleigh scattering is a result of smaller particles than the associated wavelength, Mie scattering with those of the same or similar sizes and Non-selective a result of particles larger than the associated wavelength, it’s because of scattering that the sky is blue and changes colour as it rises and sets (Campbell, 2011).

At longer distances light travels across the sky during sunset as illustrated below, with the shorter waves being more readily absorbed by the atmosphere and scattered around, shorter wavelengths, like red and orange, are able to reach us hence giving sunset the varying colours (UoW, 2017).

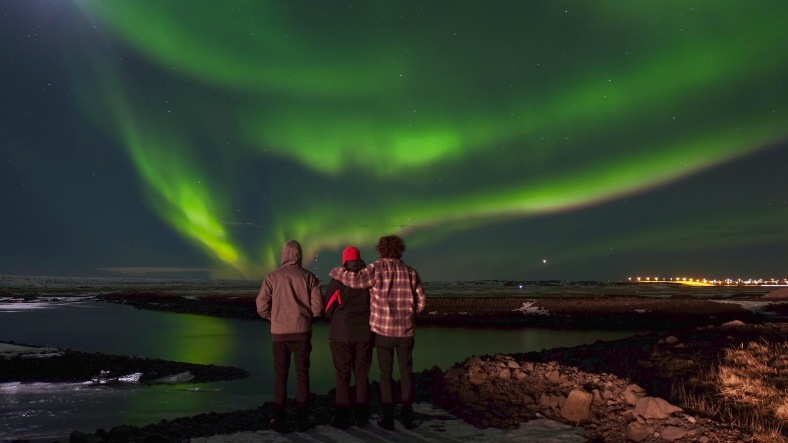
Following this photo, I managed to capture the image below, which lead me to look into how Aurora Borealis phenomenon occurred within the atmosphere. Unlike the sky being blue, the reason auroras occur is because solar winds distort the earth’s magnetic field allowing for charged particles from the sun to enter the atmosphere and energise gases, making them glow (BBC, 2017) this tends to occur more frequently nearer the magnetic poles.

Version 6

This aspect of remote sensing was incredibly insightful, it taught me several things about the Earth’s atmosphere I had witnessed but did not actually know the cause off, making me wonder what else do I see and can be answered by remote sensing?

References

Aggarwal, S. (2004). Principles of remote sensing. Satellite remote sensing and GIS applications in agricultural meteorology23

BBC (2017). What are the Northern Lights? – BBC News. [online] BBC News. Available at: http://www.bbc.co.uk/news/science-environment-26381685 [Accessed 22 May 2017].

Campbell, J. (2011). Introduction to Remote Sensing. Taylor & Francis, London.

NASA (2017). Remote Sensing : Feature Articles. [online] Earthobservatory.nasa.gov. Available at: https://earthobservatory.nasa.gov/Features/RemoteSensing/remote_04.php [Accessed 21 May 2017].

UoW (2017). What Determines Sky’s Colors At Sunrise And Sunset?. [online] ScienceDaily. Available at: https://www.sciencedaily.com/releases/2007/11/071108135522.htm [Accessed 13 Mar. 2017].


A Brief History of Remote Sensing

According to the United Nations Office for Outer Space Affairs (UNOOSA, 2016), there were 1419 operational satellites orbiting Earth in 2016 and around a quarter of these are Earth-observing.

Remote sensing arose with the development of flight and photography. The two together allowed for the balloonist G Tournachon to create the first aerial photographs of Paris in 1858. Along with this, there were several other methods deployed to produce aerial photographs, from pigeons to rockets, but these were quickly filtered out of practical use. Amongst many other technological developments, war acted as a catalyst to the development of Remote Sensing, with it becoming prolific in airborne surveillance and reconnaissance up until the Cold War. Figure 1 below shows how remote sensing was used in world war 1 to locate trenches for military use.Screen Shot 2017-02-20 at 12.19.47.png

What I have come to realise is how recent remote sensing as a source of information actually is and how much has changed within such a short period of time, making me curious to where this course will lead and the opportunities remote sensing currently has and what it holds in the future.

References

UNOOSA (2017). UNOOSA. [online] Available at: http://www.unoosa.org/ [Accessed 23 May 2017].

What is remote sensing?

An idea that really stuck with me about Remote Sensing was that the data it gained involved no intervention, in comparison to most scientific measurements, which involve a type of manual application (Lillesand et al., 2015). Even the use of our eyes is a form of remote sensing and that is effectively how it works. It utilises electromagnetic radiation that is reflected or emitted from the Earth’s surface which can then be generated into a vast range of images. Many of these images produced are a result of radiation that is not visible by the human eye, unleashing incredible potential in understanding many of the Earth’s processes. Satellites record this information from different portions of the electromagnetic spectrum (Figure 1), which is measured by their wavelengths, and these invisible types of light are assigned visible colours to represent them.

The Larson C Ice sheet in Antarctica is currently on the brink of producing an ice berg the size of Delaware, which without infrared imaging would be a lot harder to see, however Figure 2 shows clearly the crack by representing water in the crack as black as a result of satellite imagery from the project MIDAS Sentinel-1 radar satellite, I currently don’t quite understand how the image differentiates between the crack and the ice cover. An aspect of remote sensing which I am planning on better understanding.

The crack through Larsen C ice shelf is visible as a dark line from bottom right to top left of this satellite image (MIDAS, 2017)

References

Lillesand, T., Kiefer, R.W. and Chipman, J. (2015) Remote sensing and image interpretation. Hoboken, NJ, United States: John Wiley & Sons.

MIDAS, P. (2017). Larsen C Ice Shelf rift continues to grow. [online] Project MIDAS. Available at: http://www.projectmidas.org/blog/larsen-c-rift-continues-to-grow/ [Accessed 23 May 2017].

Introduction

This blog will effectively act as a virtual timeline of my learning throughout the Remote Sensing course at the University of Manchester. It is going to be posted in a chronological order and guided by the arguments and information brought about from the lectures, tutorials and practicals.  The posts will likely be sporadic and varied, depending on the different tangents and events that occur throughout the 12 week period, but will hopefully be interlinked in a manner that augments my learning of the subject.

Initially, my interest in Remote Sensing came from its use in other subjects such as GIS and Green Planet, which gathered a lot of its data from Remote Sensing related techniques and then manipulated the data in a way that made it understandable. Intrigued by where this data came from then led me to research remote sensing and its wide range of applications, which has since sparked potential dissertation ideas that would utilise remote sensing. I also have a real interest in Chemistry and hope to utilise and further develop my understanding, through its use in Remote Sensing.

An interest I am specifically interested in is boreal forests and how their advancement northwards has altered the albedo of those regions and the subsequent effects this has on the surrounding environment. Entwining this with GIS and dendrochronology I believe could advance the understanding of these processes and would be a potentially produce a really interesting dissertation, hence this blog may also be heavily linked to this, which could lead to detailed blog posts.